If your company data comes from multiple sources or you run out of cells in Excel, activate PowerPivot and the Data Model in Excel.
What is Power Pivot?
Power Pivot is an add-on for Excel called PowerPivot released by Microsoft allows you to generate reports by combining data from multiple, large datasets. You can combine data from Excel, Access, SAP, SQL, SharePoint, Feeds and summarise them into neat PivotTables or PivotCharts.
What is the Data Model
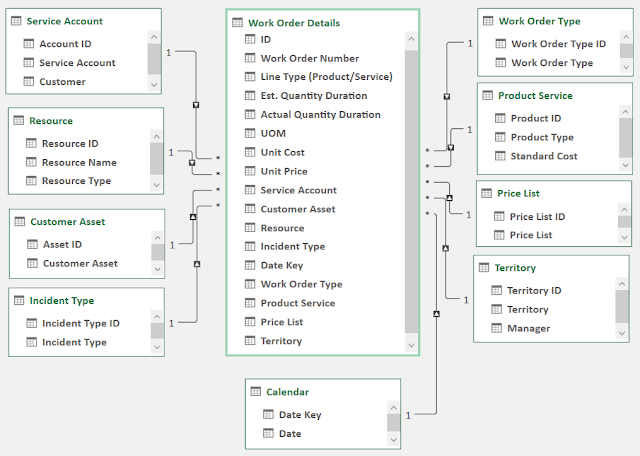
PowerPivot enable the Data Model. In Excel, the Data Model is a feature that allows you to create relationships between tables and perform more advanced data analysis. It enables you to work with large datasets and combine data from multiple sources seamlessly. By using the Data Model, you can create PivotTables and PivotCharts that span multiple tables, use DAX (Data Analysis Expressions) formulas for more complex calculations, and build more sophisticated reports. This feature is particularly useful for business intelligence and data analysis tasks, providing a powerful toolset for handling and analyzing large sets of data in Excel.
Who can user PowerPivots?
With a bit of training, anyone. The PowerPivot tab in Excel looks and feels like, well, any other Excel tab. The PowerPivot window offers a simple and intuitive interface to connect to your data sources and combine them.
You are at an advantage if you are familiar with: database relationships – Microsoft Access relies on them, now is a good idea to brush up on the topic); queries – again, Microsoft Access is a good introduction to them but your previous experience with SQL or the old Excel Query window will give you a head start) and PivotTable Reports and PivotCharts
where do I install the PowerPivot add-on from?